Use the Scatterwidget with AnnData from Notebook#
This tutorial is an example of how to use the Napari-Spatialdata ScatterWidget from a notebook.
Import packages and data#
There are two options to install napari-spatialdata:
(1) Run pip install napari-spatialdata
or,
(2) Clone this repo and run pip install -e .
from napari_spatialdata import QtAdataScatterWidget
import squidpy as sq
import matplotlib.pyplot as plt
Load in the AnnData:
adata = sq.datasets.visium_hne_adata()
The following line is needed to initialize a widget without a QApplication:
%gui qt5
Open the ScatterWidget:
widget = QtAdataScatterWidget(adata)
widget.show()
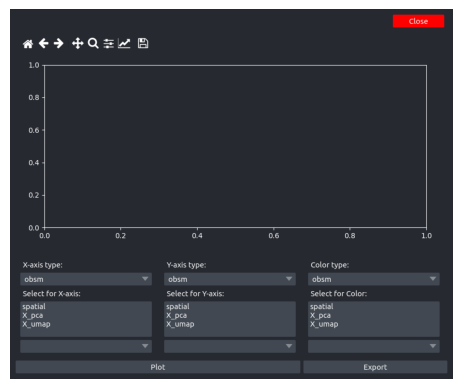
The widget:
plt.imshow(widget.screenshot())
plt.axis('off')
(-0.5, 861.5, 719.5, -0.5)

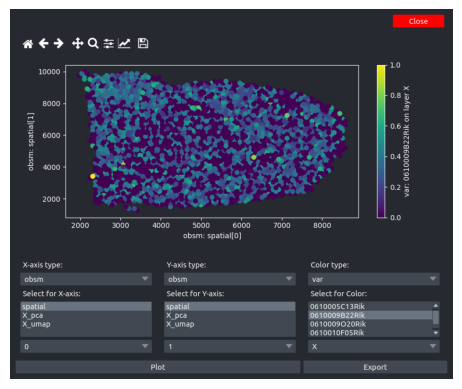
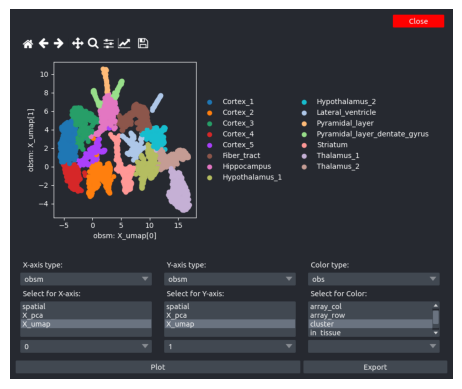
Some examples of scatterplots:
plt.imshow(widget.screenshot())
plt.axis('off')
(-0.5, 861.5, 719.5, -0.5)

plt.imshow(widget.screenshot())
plt.axis('off')
(-0.5, 861.5, 719.5, -0.5)
