Technology focus: CosMx#
This notebook will present a rough overview of the plotting functionalities that spatialdata implements for COSMX data.
Loading the data#
Please download the data from here: CosMx dataset and adjust the variable containing the location of the .zarr file.
cosmx_zarr_path = "./cosmx.zarr"
import warnings

import spatialdata as sd

warnings.filterwarnings("ignore")

cosmx_sdata = sd.read_zarr(cosmx_zarr_path)
cosmx_sdata
SpatialData object with:
├── Images
│     ├── '1_image': SpatialImage[cyx] (3, 3648, 5472)
│     ├── '2_image': SpatialImage[cyx] (3, 3648, 5472)
│     ├── '3_image': SpatialImage[cyx] (3, 3648, 5472)
│     ├── '4_image': SpatialImage[cyx] (3, 3648, 5472)
│     ├── '5_image': SpatialImage[cyx] (3, 3648, 5472)
│     ├── '6_image': SpatialImage[cyx] (3, 3648, 5472)
│     ├── '7_image': SpatialImage[cyx] (3, 3648, 5472)
│     ├── '8_image': SpatialImage[cyx] (3, 3648, 5472)
│     ├── '9_image': SpatialImage[cyx] (3, 3648, 5472)
│     ├── '10_image': SpatialImage[cyx] (3, 3648, 5472)
│     ├── '11_image': SpatialImage[cyx] (3, 3648, 5472)
│     ├── '12_image': SpatialImage[cyx] (3, 3648, 5472)
│     ├── '13_image': SpatialImage[cyx] (3, 3648, 5472)
│     ├── '14_image': SpatialImage[cyx] (3, 3648, 5472)
│     ├── '15_image': SpatialImage[cyx] (3, 3648, 5472)
│     ├── '16_image': SpatialImage[cyx] (3, 3648, 5472)
│     ├── '17_image': SpatialImage[cyx] (3, 3648, 5472)
│     ├── '18_image': SpatialImage[cyx] (3, 3648, 5472)
│     ├── '19_image': SpatialImage[cyx] (3, 3648, 5472)
│     ├── '20_image': SpatialImage[cyx] (3, 3648, 5472)
│     ├── '21_image': SpatialImage[cyx] (3, 3648, 5472)
│     ├── '22_image': SpatialImage[cyx] (3, 3648, 5472)
│     ├── '23_image': SpatialImage[cyx] (3, 3648, 5472)
│     ├── '24_image': SpatialImage[cyx] (3, 3648, 5472)
│     ├── '25_image': SpatialImage[cyx] (3, 3648, 5472)
│     ├── '26_image': SpatialImage[cyx] (3, 3648, 5472)
│     ├── '27_image': SpatialImage[cyx] (3, 3648, 5472)
│     ├── '28_image': SpatialImage[cyx] (3, 3648, 5472)
│     ├── '29_image': SpatialImage[cyx] (3, 3648, 5472)
│     └── '30_image': SpatialImage[cyx] (3, 3648, 5472)
├── Labels
│     ├── '1_labels': SpatialImage[yx] (3648, 5472)
│     ├── '2_labels': SpatialImage[yx] (3648, 5472)
│     ├── '3_labels': SpatialImage[yx] (3648, 5472)
│     ├── '4_labels': SpatialImage[yx] (3648, 5472)
│     ├── '5_labels': SpatialImage[yx] (3648, 5472)
│     ├── '6_labels': SpatialImage[yx] (3648, 5472)
│     ├── '7_labels': SpatialImage[yx] (3648, 5472)
│     ├── '8_labels': SpatialImage[yx] (3648, 5472)
│     ├── '9_labels': SpatialImage[yx] (3648, 5472)
│     ├── '10_labels': SpatialImage[yx] (3648, 5472)
│     ├── '11_labels': SpatialImage[yx] (3648, 5472)
│     ├── '12_labels': SpatialImage[yx] (3648, 5472)
│     ├── '13_labels': SpatialImage[yx] (3648, 5472)
│     ├── '14_labels': SpatialImage[yx] (3648, 5472)
│     ├── '15_labels': SpatialImage[yx] (3648, 5472)
│     ├── '16_labels': SpatialImage[yx] (3648, 5472)
│     ├── '17_labels': SpatialImage[yx] (3648, 5472)
│     ├── '18_labels': SpatialImage[yx] (3648, 5472)
│     ├── '19_labels': SpatialImage[yx] (3648, 5472)
│     ├── '20_labels': SpatialImage[yx] (3648, 5472)
│     ├── '21_labels': SpatialImage[yx] (3648, 5472)
│     ├── '22_labels': SpatialImage[yx] (3648, 5472)
│     ├── '23_labels': SpatialImage[yx] (3648, 5472)
│     ├── '24_labels': SpatialImage[yx] (3648, 5472)
│     ├── '25_labels': SpatialImage[yx] (3648, 5472)
│     ├── '26_labels': SpatialImage[yx] (3648, 5472)
│     ├── '27_labels': SpatialImage[yx] (3648, 5472)
│     ├── '28_labels': SpatialImage[yx] (3648, 5472)
│     ├── '29_labels': SpatialImage[yx] (3648, 5472)
│     └── '30_labels': SpatialImage[yx] (3648, 5472)
├── Points
│     ├── '1_points': DataFrame with shape: (581747, 9) (2D points)
│     ├── '2_points': DataFrame with shape: (1928480, 9) (2D points)
│     ├── '3_points': DataFrame with shape: (1469614, 9) (2D points)
│     ├── '4_points': DataFrame with shape: (1762072, 9) (2D points)
│     ├── '5_points': DataFrame with shape: (1940851, 9) (2D points)
│     ├── '6_points': DataFrame with shape: (0, 9) (2D points)
│     ├── '7_points': DataFrame with shape: (1984798, 9) (2D points)
│     ├── '8_points': DataFrame with shape: (1793758, 9) (2D points)
│     ├── '9_points': DataFrame with shape: (1161574, 9) (2D points)
│     ├── '10_points': DataFrame with shape: (1377729, 9) (2D points)
│     ├── '11_points': DataFrame with shape: (1730901, 9) (2D points)
│     ├── '12_points': DataFrame with shape: (1719410, 9) (2D points)
│     ├── '13_points': DataFrame with shape: (1155204, 9) (2D points)
│     ├── '14_points': DataFrame with shape: (998577, 9) (2D points)
│     ├── '15_points': DataFrame with shape: (1220996, 9) (2D points)
│     ├── '16_points': DataFrame with shape: (1972482, 9) (2D points)
│     ├── '17_points': DataFrame with shape: (1567489, 9) (2D points)
│     ├── '18_points': DataFrame with shape: (1124222, 9) (2D points)
│     ├── '19_points': DataFrame with shape: (969657, 9) (2D points)
│     ├── '20_points': DataFrame with shape: (1303179, 9) (2D points)
│     ├── '21_points': DataFrame with shape: (1146492, 9) (2D points)
│     ├── '22_points': DataFrame with shape: (943272, 9) (2D points)
│     ├── '23_points': DataFrame with shape: (1106228, 9) (2D points)
│     ├── '24_points': DataFrame with shape: (884838, 9) (2D points)
│     ├── '25_points': DataFrame with shape: (961553, 9) (2D points)
│     ├── '26_points': DataFrame with shape: (1265701, 9) (2D points)
│     ├── '27_points': DataFrame with shape: (1332922, 9) (2D points)
│     ├── '28_points': DataFrame with shape: (1766990, 9) (2D points)
│     ├── '29_points': DataFrame with shape: (1462793, 9) (2D points)
│     └── '30_points': DataFrame with shape: (1653046, 9) (2D points)
└── Tables
      └── 'table': AnnData (106660, 980)
with coordinate systems:
▸ '1', with elements:
        1_image (Images), 1_labels (Labels), 1_points (Points)
▸ '2', with elements:
        2_image (Images), 2_labels (Labels), 2_points (Points)
▸ '3', with elements:
        3_image (Images), 3_labels (Labels), 3_points (Points)
▸ '4', with elements:
        4_image (Images), 4_labels (Labels), 4_points (Points)
▸ '5', with elements:
        5_image (Images), 5_labels (Labels), 5_points (Points)
▸ '6', with elements:
        6_image (Images), 6_labels (Labels), 6_points (Points)
▸ '7', with elements:
        7_image (Images), 7_labels (Labels), 7_points (Points)
▸ '8', with elements:
        8_image (Images), 8_labels (Labels), 8_points (Points)
▸ '9', with elements:
        9_image (Images), 9_labels (Labels), 9_points (Points)
▸ '10', with elements:
        10_image (Images), 10_labels (Labels), 10_points (Points)
▸ '11', with elements:
        11_image (Images), 11_labels (Labels), 11_points (Points)
▸ '12', with elements:
        12_image (Images), 12_labels (Labels), 12_points (Points)
▸ '13', with elements:
        13_image (Images), 13_labels (Labels), 13_points (Points)
▸ '14', with elements:
        14_image (Images), 14_labels (Labels), 14_points (Points)
▸ '15', with elements:
        15_image (Images), 15_labels (Labels), 15_points (Points)
▸ '16', with elements:
        16_image (Images), 16_labels (Labels), 16_points (Points)
▸ '17', with elements:
        17_image (Images), 17_labels (Labels), 17_points (Points)
▸ '18', with elements:
        18_image (Images), 18_labels (Labels), 18_points (Points)
▸ '19', with elements:
        19_image (Images), 19_labels (Labels), 19_points (Points)
▸ '20', with elements:
        20_image (Images), 20_labels (Labels), 20_points (Points)
▸ '21', with elements:
        21_image (Images), 21_labels (Labels), 21_points (Points)
▸ '22', with elements:
        22_image (Images), 22_labels (Labels), 22_points (Points)
▸ '23', with elements:
        23_image (Images), 23_labels (Labels), 23_points (Points)
▸ '24', with elements:
        24_image (Images), 24_labels (Labels), 24_points (Points)
▸ '25', with elements:
        25_image (Images), 25_labels (Labels), 25_points (Points)
▸ '26', with elements:
        26_image (Images), 26_labels (Labels), 26_points (Points)
▸ '27', with elements:
        27_image (Images), 27_labels (Labels), 27_points (Points)
▸ '28', with elements:
        28_image (Images), 28_labels (Labels), 28_points (Points)
▸ '29', with elements:
        29_image (Images), 29_labels (Labels), 29_points (Points)
▸ '30', with elements:
        30_image (Images), 30_labels (Labels), 30_points (Points)
▸ 'global', with elements:
        1_image (Images), 2_image (Images), 3_image (Images), 4_image (Images), 5_image (Images), 6_image (Images), 7_image (Images), 8_image (Images), 9_image (Images), 10_image (Images), 11_image (Images), 12_image (Images), 13_image (Images), 14_image (Images), 15_image (Images), 16_image (Images), 17_image (Images), 18_image (Images), 19_image (Images), 20_image (Images), 21_image (Images), 22_image (Images), 23_image (Images), 24_image (Images), 25_image (Images), 26_image (Images), 27_image (Images), 28_image (Images), 29_image (Images), 30_image (Images), 1_labels (Labels), 2_labels (Labels), 3_labels (Labels), 4_labels (Labels), 5_labels (Labels), 6_labels (Labels), 7_labels (Labels), 8_labels (Labels), 9_labels (Labels), 10_labels (Labels), 11_labels (Labels), 12_labels (Labels), 13_labels (Labels), 14_labels (Labels), 15_labels (Labels), 16_labels (Labels), 17_labels (Labels), 18_labels (Labels), 19_labels (Labels), 20_labels (Labels), 21_labels (Labels), 22_labels (Labels), 23_labels (Labels), 24_labels (Labels), 25_labels (Labels), 26_labels (Labels), 27_labels (Labels), 28_labels (Labels), 29_labels (Labels), 30_labels (Labels), 1_points (Points), 2_points (Points), 3_points (Points), 4_points (Points), 5_points (Points), 6_points (Points), 7_points (Points), 8_points (Points), 9_points (Points), 10_points (Points), 11_points (Points), 12_points (Points), 13_points (Points), 14_points (Points), 15_points (Points), 16_points (Points), 17_points (Points), 18_points (Points), 19_points (Points), 20_points (Points), 21_points (Points), 22_points (Points), 23_points (Points), 24_points (Points), 25_points (Points), 26_points (Points), 27_points (Points), 28_points (Points), 29_points (Points), 30_points (Points)
▸ 'global_only_image', with elements:
        1_image (Images), 2_image (Images), 3_image (Images), 4_image (Images), 5_image (Images), 6_image (Images), 7_image (Images), 8_image (Images), 9_image (Images), 10_image (Images), 11_image (Images), 12_image (Images), 13_image (Images), 14_image (Images), 15_image (Images), 16_image (Images), 17_image (Images), 18_image (Images), 19_image (Images), 20_image (Images), 21_image (Images), 22_image (Images), 23_image (Images), 24_image (Images), 25_image (Images), 26_image (Images), 27_image (Images), 28_image (Images), 29_image (Images), 30_image (Images)
▸ 'global_only_labels', with elements:
        1_labels (Labels), 2_labels (Labels), 3_labels (Labels), 4_labels (Labels), 5_labels (Labels), 6_labels (Labels), 7_labels (Labels), 8_labels (Labels), 9_labels (Labels), 10_labels (Labels), 11_labels (Labels), 12_labels (Labels), 13_labels (Labels), 14_labels (Labels), 15_labels (Labels), 16_labels (Labels), 17_labels (Labels), 18_labels (Labels), 19_labels (Labels), 20_labels (Labels), 21_labels (Labels), 22_labels (Labels), 23_labels (Labels), 24_labels (Labels), 25_labels (Labels), 26_labels (Labels), 27_labels (Labels), 28_labels (Labels), 29_labels (Labels), 30_labels (Labels), 1_points (Points), 2_points (Points), 3_points (Points), 4_points (Points), 5_points (Points), 6_points (Points), 7_points (Points), 8_points (Points), 9_points (Points), 10_points (Points), 11_points (Points), 12_points (Points), 13_points (Points), 14_points (Points), 15_points (Points), 16_points (Points), 17_points (Points), 18_points (Points), 19_points (Points), 20_points (Points), 21_points (Points), 22_points (Points), 23_points (Points), 24_points (Points), 25_points (Points), 26_points (Points), 27_points (Points), 28_points (Points), 29_points (Points), 30_points (Points)
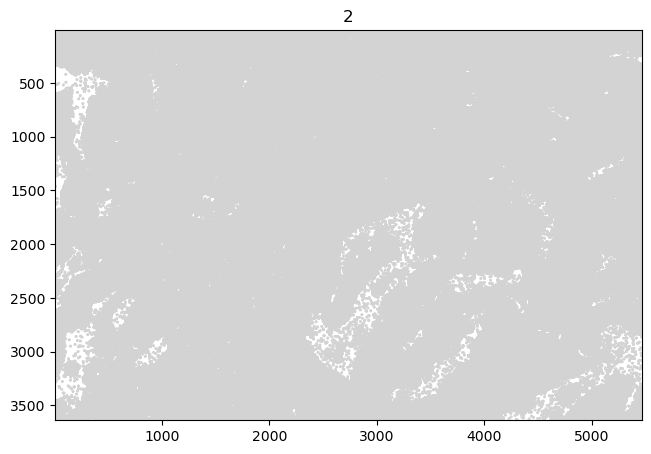
Visualise the data#
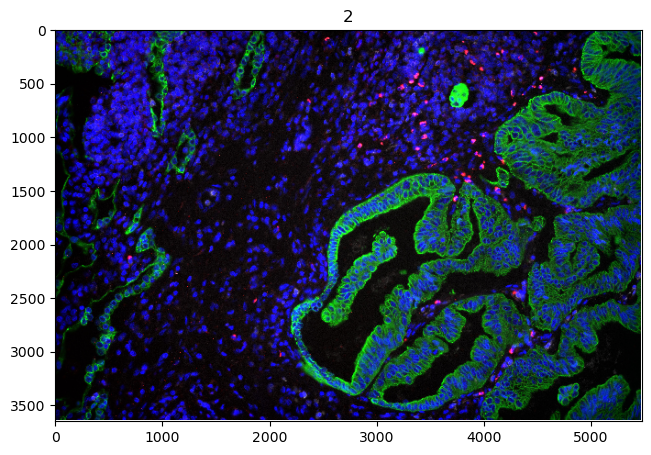
As we can see, the data contains 30 slides which would make plotting very cumbersome. Thereofore, we will only focus on one coordinate systems for now (2) but then also later provide a plot of all coordinate systems. Let’s visualise some of the data contained in the spatialdata object. For this, we will need to load the spatialdata-plot library.
import spatialdata_plot

cosmx_sdata.pl.render_images().pl.show(coordinate_systems=["2"])
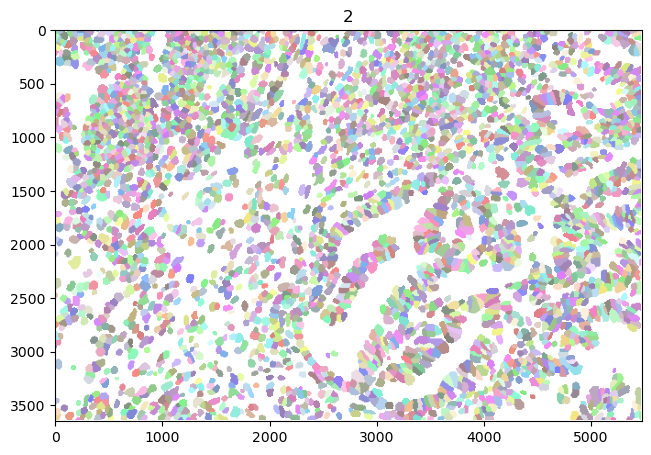
cosmx_sdata.pl.render_labels().pl.show(coordinate_systems=["2"])
cosmx_sdata.pl.render_points().pl.show(coordinate_systems=["2"])
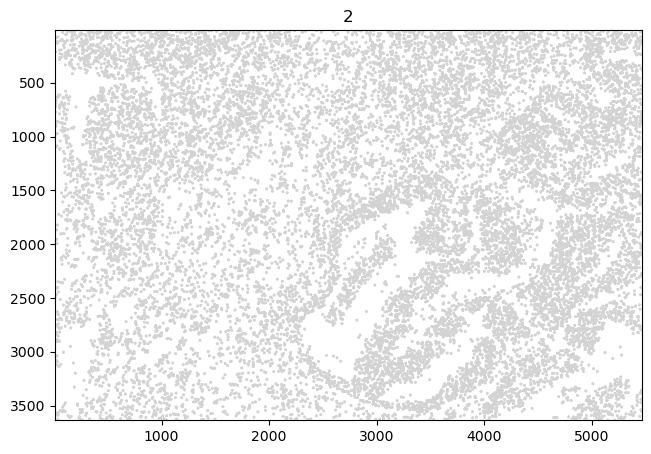
We can see that the points layer features too many points to properly visualise in a small’ish plot. Therefore, we reduce their number to only 1 % of the total.
cosmx_sdata.points["2_points"] = cosmx_sdata.points["2_points"].sample(frac=0.01)
cosmx_sdata.pl.render_points().pl.show(coordinate_systems=["2"])
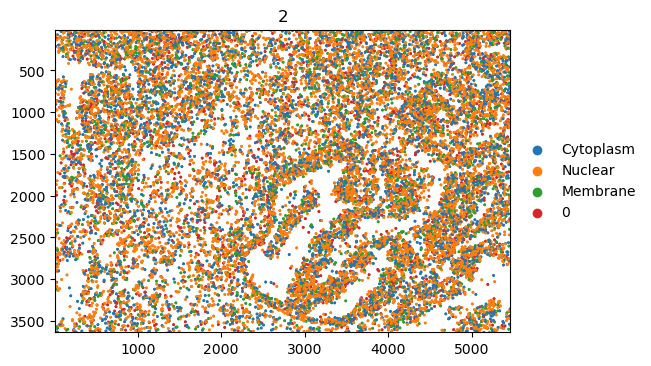
Furthermore, we are going to convert the CellComp column of the points layer to a categorical column. This will allow us to colour the points by their cell type.
import pandas as pd

cat_type = pd.CategoricalDtype(cosmx_sdata.points["2_points"]["CellComp"].unique())
cosmx_sdata.points["2_points"]["CellComp"] = cosmx_sdata.points["2_points"]["CellComp"].astype(cat_type)

cosmx_sdata.pl.render_points(color="CellComp").pl.show(coordinate_systems=["2"])
We can further overlay that information with the cell_labels. This will allow us to see which points actually lay inside the borders of an annotated cell.
import matplotlib.pyplot as plt

fig, ax = plt.subplots(ncols=1, nrows=1, figsize=(12, 12))

# As you can see here we use a fill_alpha of 1. This is because of a bug when trying to plot purely the
# outline. This issue is described here: https://github.com/scverse/spatialdata-plot/issues/240
(
    cosmx_sdata.pl.render_points(elements="2_points", color="CellComp", alpha=0.5)  #
    .pl.render_labels(elements="2_labels", fill_alpha=1, outline=True, contour_px=3)
    .pl.show(coordinate_systems=["2"], ax=ax)
)
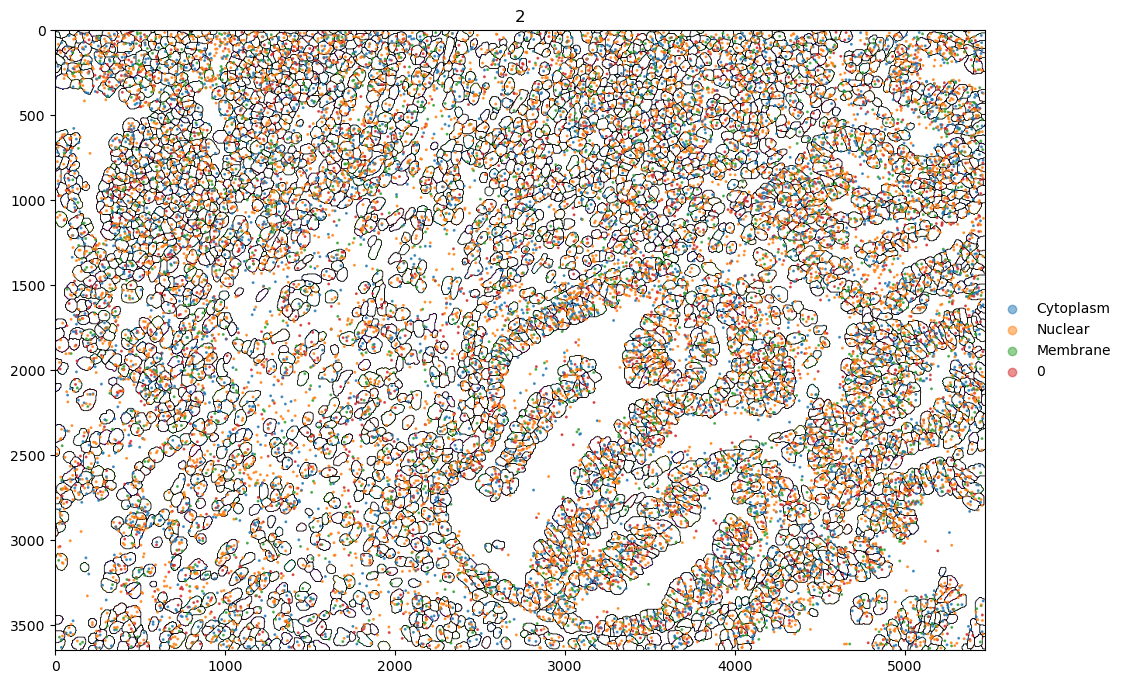
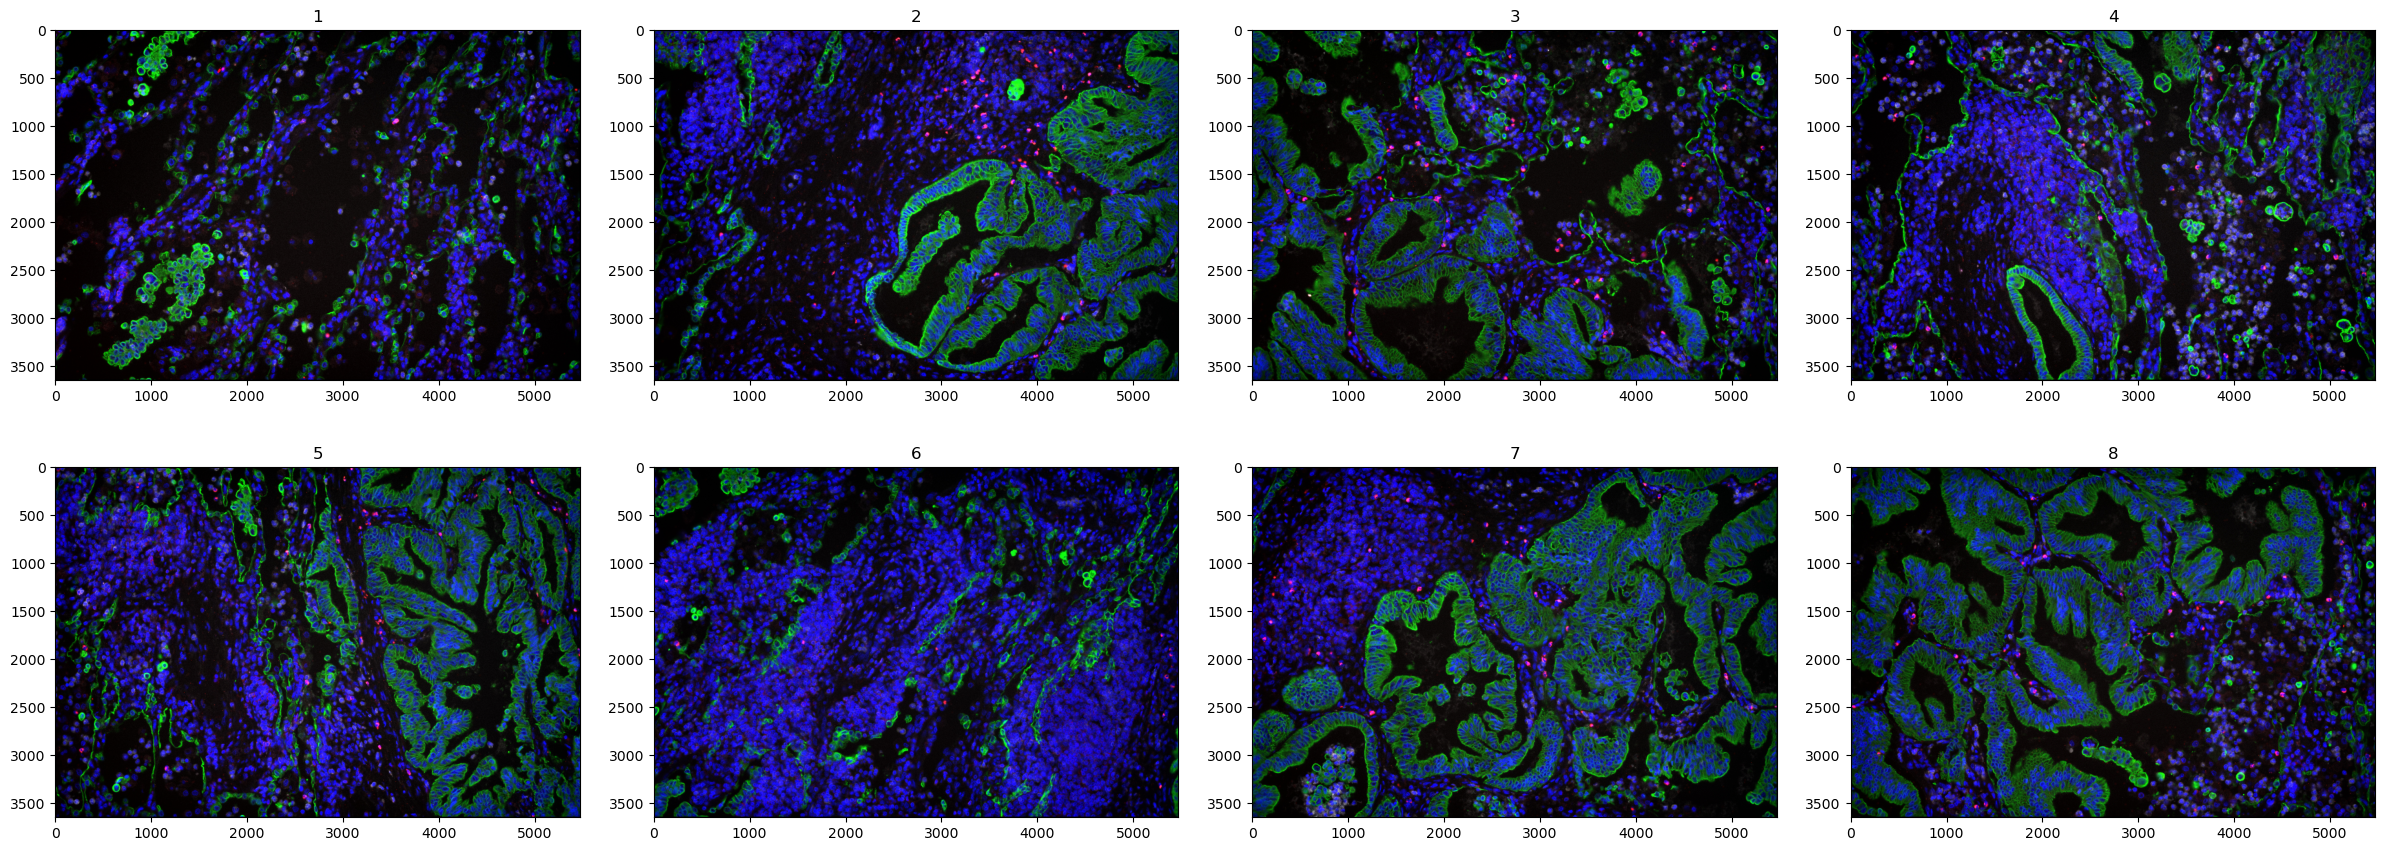
We can see, that the 0 label locates outside of the annotated cells. Finally, let’s visualise all images contained in the data.
cosmx_sdata.pl.render_images().pl.show(coordinate_systems=[str(i + 1) for i in range(8)])